 IMAGE Team - The Pantheon project
The objective is to extract forested areas in aerial images captured from Google Maps by a simple snapshot. The example images are located in Lower-Normandy (France). In such Norman bocage landscape, the forested areas are usually but woods and hedges.
The processing plan described here is suitable for images with the same resolution (1 pixel: 5,932m on the ground). With a different resolution, the parameters should be adjusted.
 | 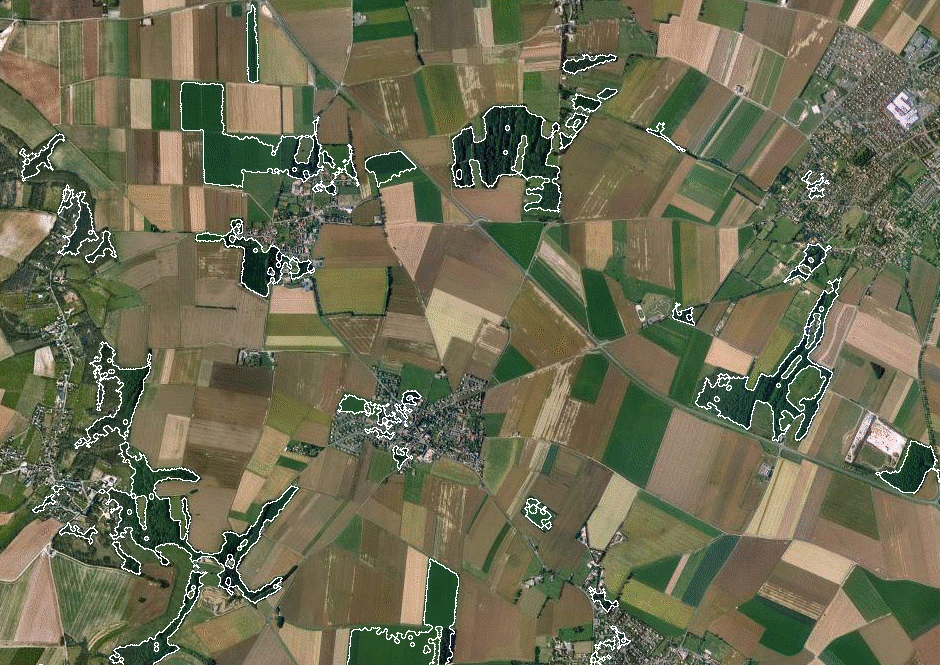 |
| The source image. | The detected forested areas. |
The method is mainly based on the analysis of color as forested areas appear in the images as dark green regions. An additiona measure of heterogeneity is used to distinguish certain fields from the forested areas.
Thus, the processing algorithm is very simple, and consists only in combining the results of three different thresholding operations:
The image is first smoothed with a Gaussian low-pass filter in order to reduce noise and block effect due to JPEG image encoding.
pany2pan input.jpg input.pan pgaussianfiltering 0.5 input.pan image1.pan | 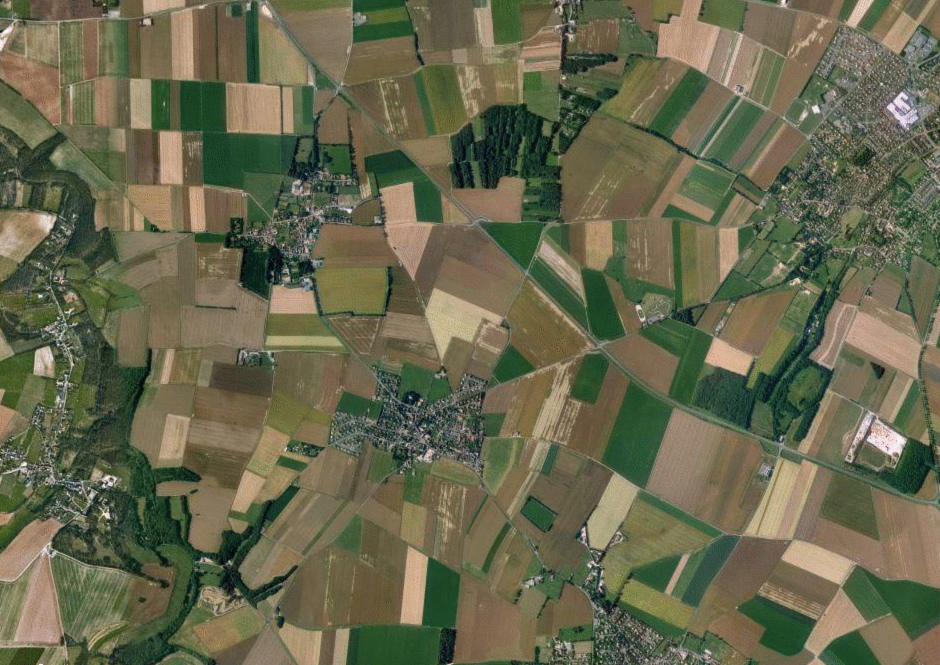 |
| image1.pan: Preprocessed image. |
To study the color, we will move into the colo space HSL (Hue-Saturation-Luminance). The principle is to select in the TLS image only the pixels with hue value between 110° and 200°, which correspond to green pixels.
prgb2hsl image1.pan tmp1.pan pgetband 0 tmp1.pan tmp2.pan pbinarization 110 200 tmp2.pan tmp3.pan # closing pdilatation 0 1 tmp3.pan tmp4.pan perosion 0 1 tmp4.pan tmp5.pan | 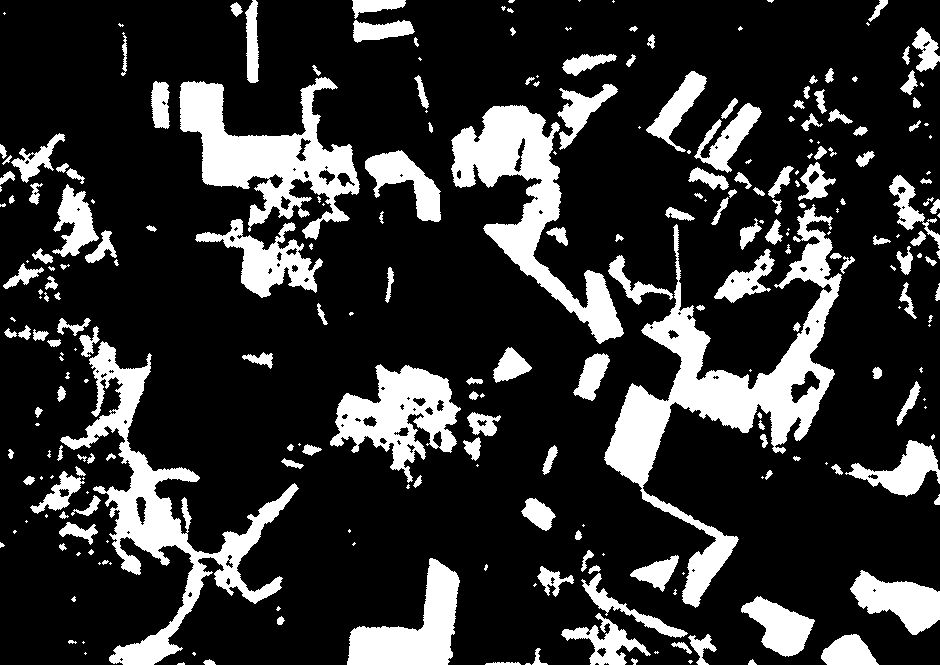 |
| tmp5.pan: The green regions. |
To select the dark areas, only those pixels with a low luminance value, namely a value between 0 and 60, are selected.
prgb2hsl image1.pan tmp1.pan pgetband 2 tmp1.pan tmp8.pan pbinarization 0 60 tmp8.pan tmp9.pan # closing pdilatation 0 1 tmp9.pan tmp10.pan perosion 0 1 tmp10.pan tmp11.pan | 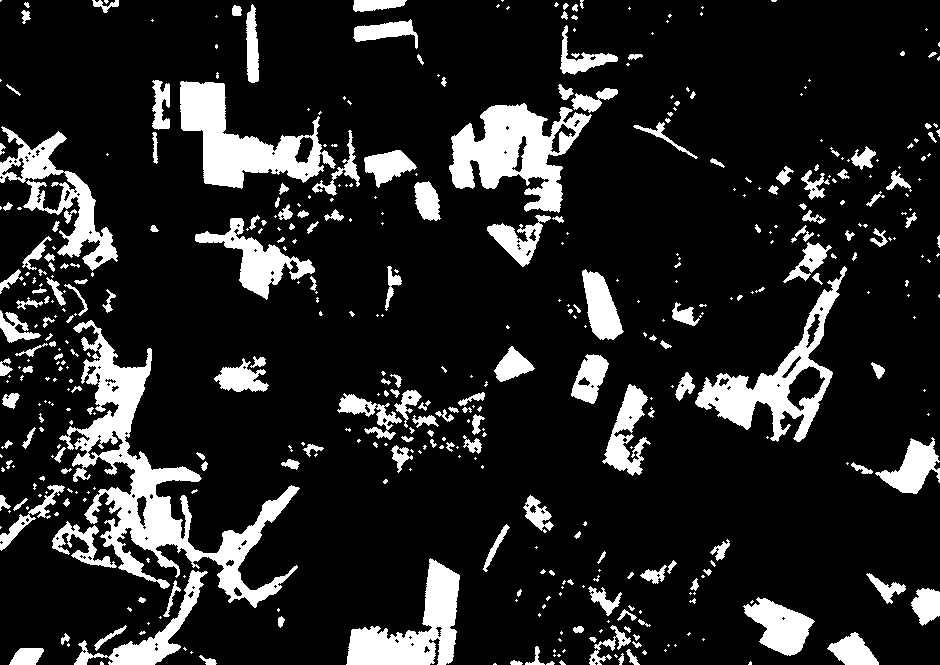 |
| tmp11.pan: The dark regions. |
By combining the two previous results, the green dark regions are detected.
A small closing with a half-size 1 fills the hole with size ≤ 1 pixel radius, then an opening eliminates too small regions (≤ 1 pixel radius).
pand tmp5.pan tmp11.pan tmp12.pan plabeling 8 tmp12.pan tmp13.pan # opening perosion 0 1 tmp13.pan tmp14.pan pdilatation 0 1 tmp14pan tmp15.pan | 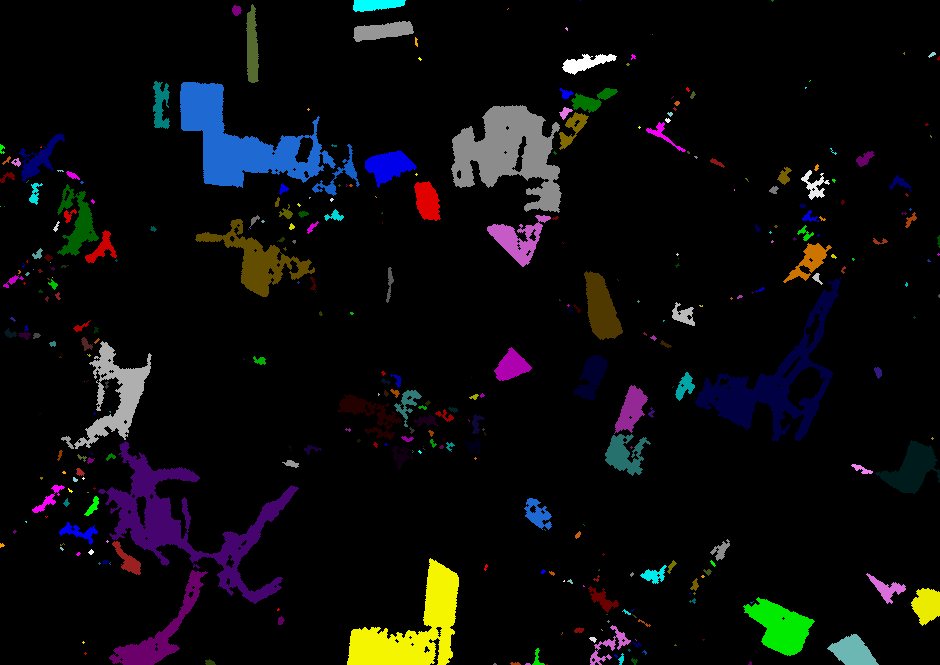 |
| tmp15.pan : The green dark regions. |
In the current result, there are still some agricultural fields. To remove the fields from the result, we use the variance since the forested areas are more heterogeneous than the fields (due to foliage). We keep from the previous regions, only those which have a variance greater than 50.
pgetband 2 tmp1.pan tmp16.pan pvarianceselection 1 50 tmp15.pan tmp16.pan tmp17.pan | 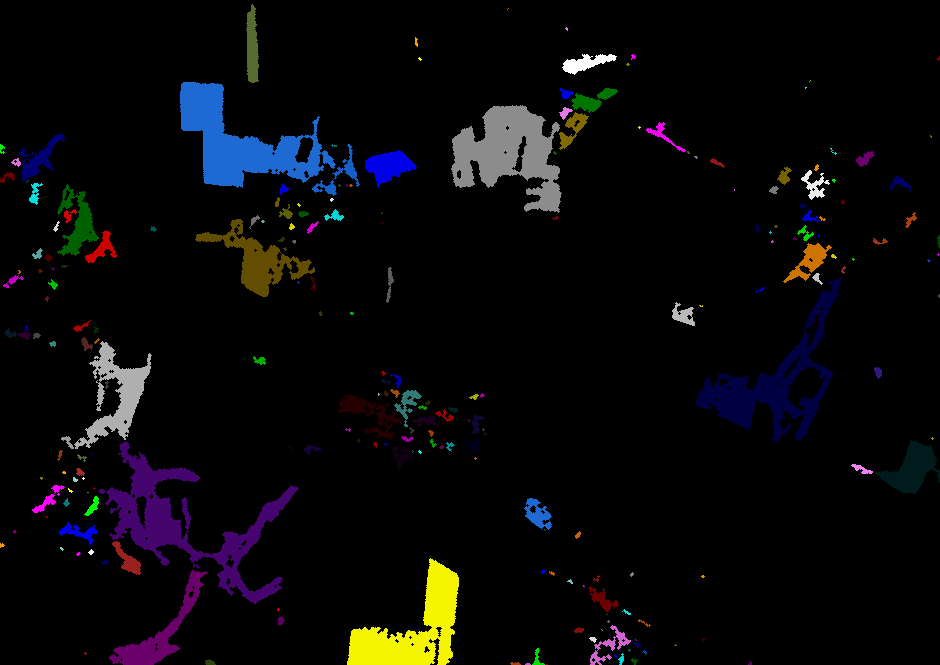 |
| tmp17.pan: The green dark heterogeneous regions. |
False regions are removed using the surface area. We keep only regions with surface area ≥ 200 pixels (7000 m2 on the ground).
pareaselection 1 200 tmp17.pan tmp18.pan |  |
| tmp18.pan: The candidate regions. |
This operation is just added for the sake of visualization. The cell boundaries are superimposed on the original image.
pboundary 8 tmp18.pan tmp19.pan psuperimposition 7 input.pan tmp19.pan output.pan ppan2jpeg output.pan output.jpg |  |
| output.pan: Visualization of the result. |
 Code
Code