 IMAGE Team - The Pantheon project
The objective is to extract urban areas in aerial images captured from Google Maps by a simple screenshot. The images given as examples are located in the region of Creully in Lower-Normandy (France).
The proposed image processing is suitable for images with the same resolution as the images given as examples, that is 1 pixel represents 5,932 m on the ground. With a different resolution, the parameter values will be adjusted.
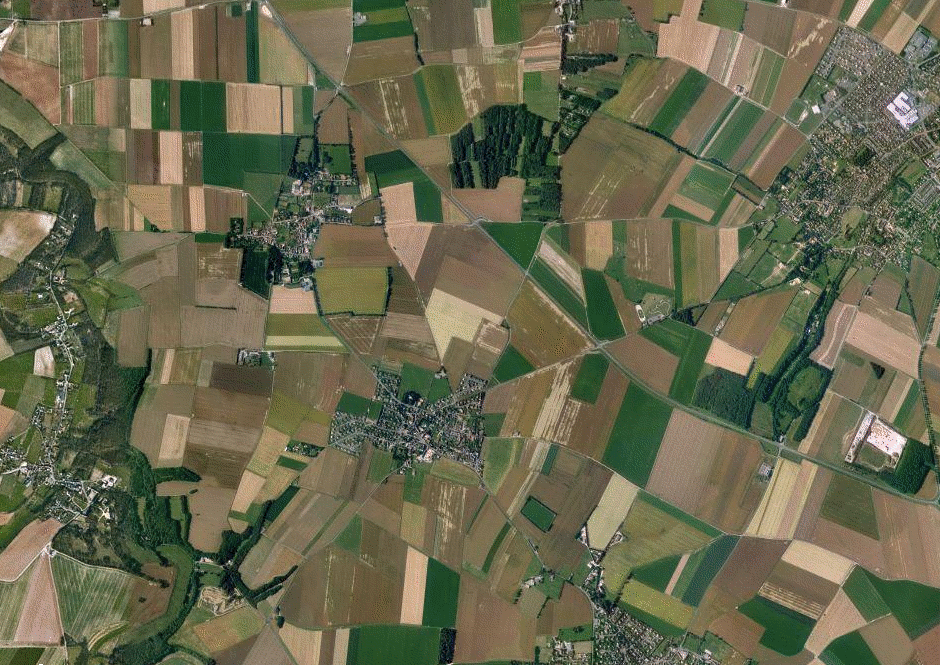 | 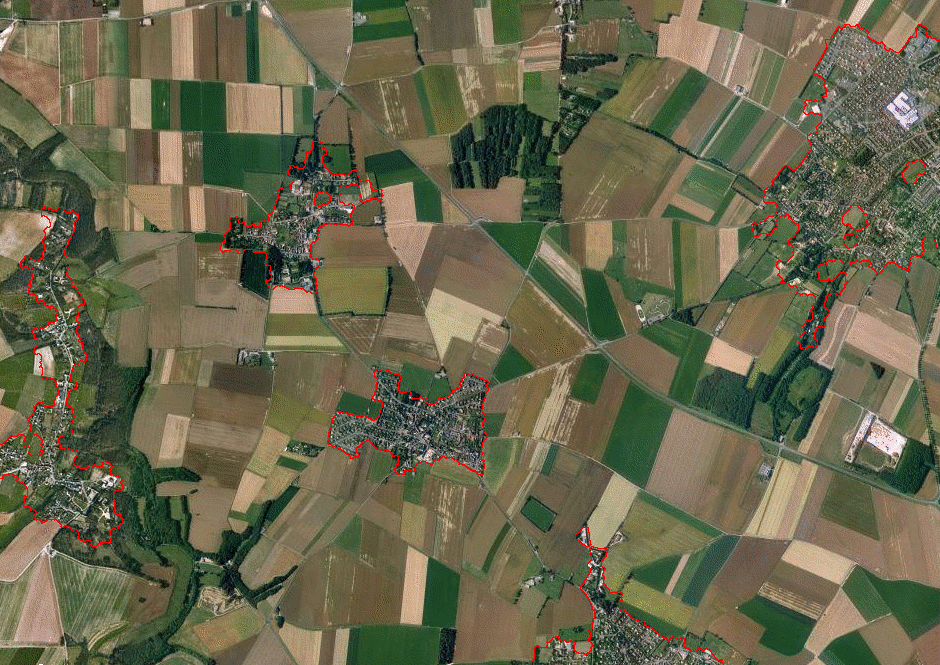 |
| The source image. | The detected urban areas. |
The method is based on the assumption that urban areas are characterized by large areas with a texture of type contour.
Thus, the algorithm is straightforward:
Since this strategy is based on texture analysis, unwanted textured regions might be found in the result, such as forest. These false alarms might be eliminated afterwards using other criteria such as color, which is not done here.
The color is not an intrinsic characteristic of urban areas. For example, the house roofs can be of any color. So, we only use the lightness component of the colors.
Then, the image is smoothed with a Gaussian low-pass filter in order to reduce noise and block effect due to JPEG image encoding.
pany2pan input.jpg input.pan prgb2gray 0.299 0.587 0.114 input.pan tmp2.pan pgaussianfiltering 0.5 tmp2.pan image1.pan | 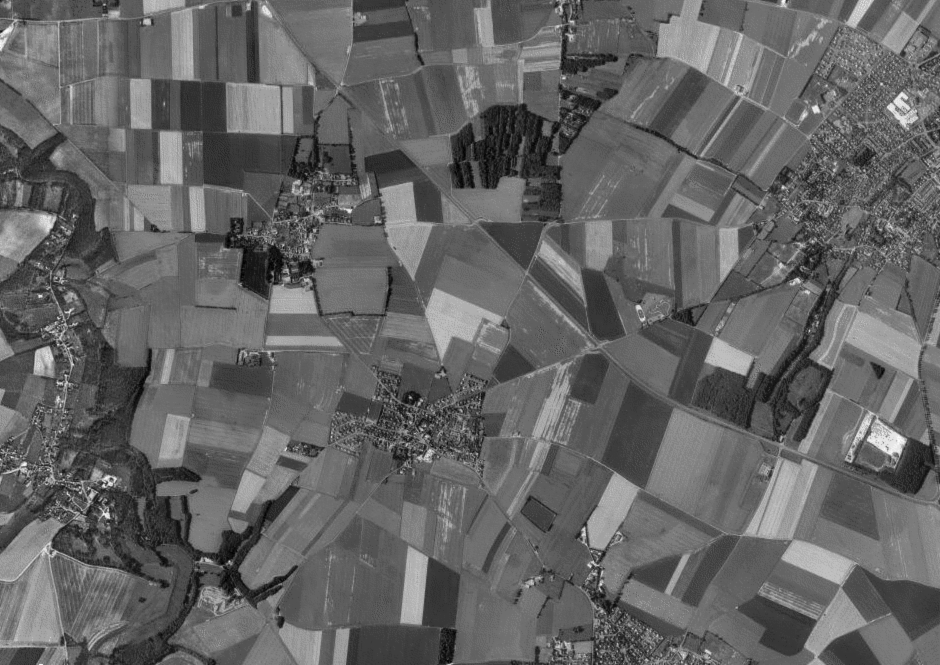 |
| image1.pan: After preprocessing. |
Notice that urban areas are regions with a high density of edges due for example by house or street borders, while other regions of the image (eg. , fields, water) are smoother.
The contours are detected by simple image gradient followed by thresholding based on interclass variance maximization (Otsu, 1978).
pgradient 1 image1.pan tmp3.pan tmp4.pan pvariancebinarization tmp3.pan image2.pan | 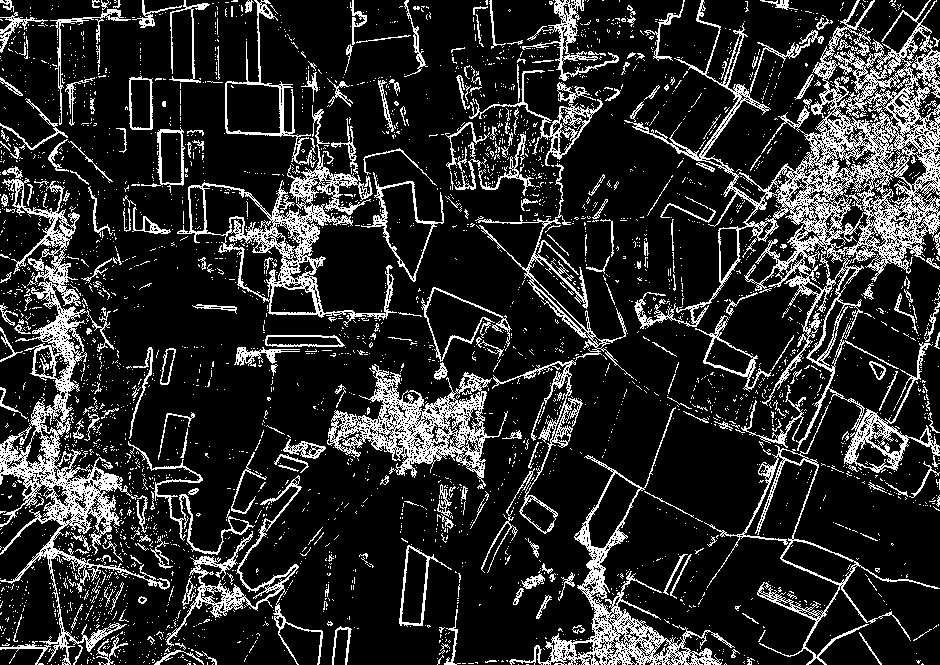 |
| image2.pan: After edge detection. |
To delineate areas of high density of edges, one method is to dilate the boundaries in order to merge close contours into a same blob. We consider that two houses have borders at a maximum distance of 5 pixels in the image (29.6 m in the ground). So a simple dilation of 3 pixels on both side of the edges is sufficient to merge two edges at a distance ≤ 5 pixels.
To locate the regions from the blobs, it is necessary to separate the blobs from each others by removing the links between them (eg., street, hedge). A geodesic opening with a disk of radius 3 deletes the links of half-size < 3 pixels thickness.
pdilatation 0 2 image2.pan tmp5.pan perosion 0 2 tmp5.pan image3.pan perosion 2 3 image3.pan tmp6.pan pgeodesicdilatation 0 2 3.0 tmp6.pan image3.pan image4.pan | 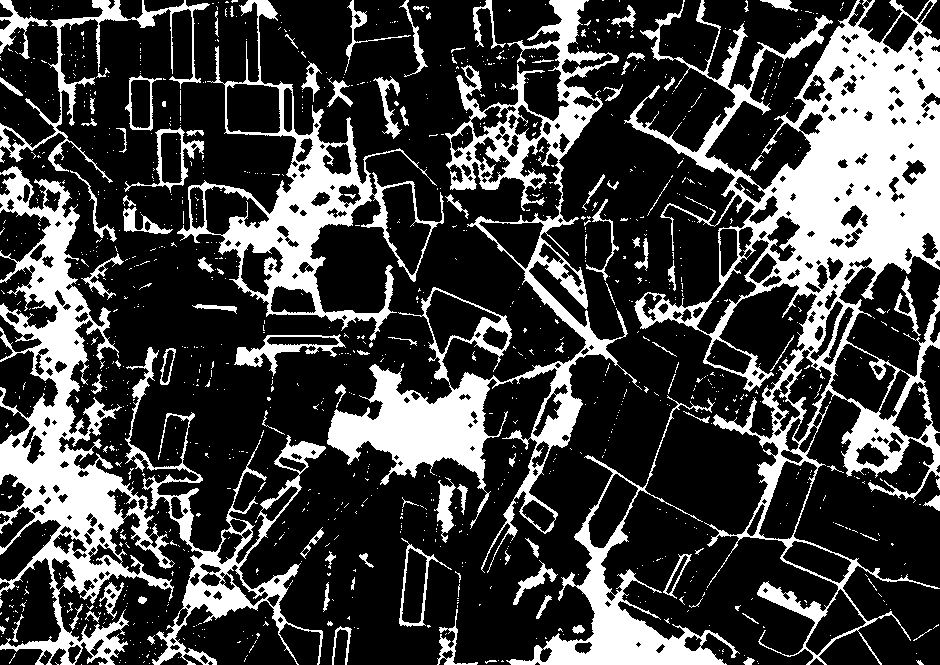 |
| image3.pan: After closing. | 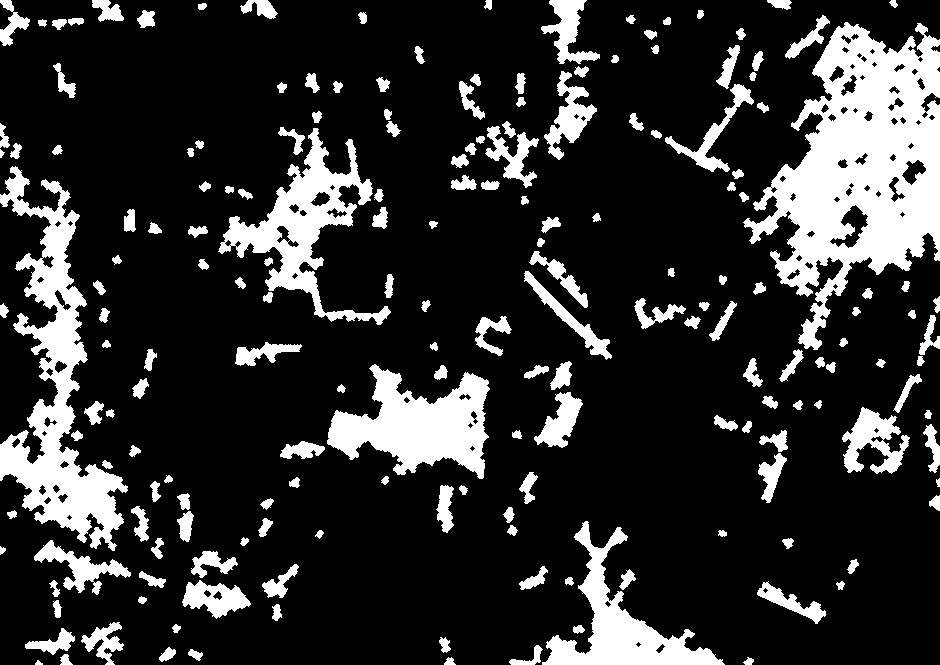 |
| image4.pan: After geodesic opening. |
Regions are formed with blob in which the holes are filled. However, only regions with area surface less than 10 x 10 pixels (60 x 60 m2 on the ground) are filled. Generally, larger holes correspond to green spaces or football stadiums within the urban area that should not be agglomerated in the urban area.
A geodesic closing fills the internal holes of a radius < 5 and a geodesic opening the same size allows to build compact regions without barbs.
pdilatation 2 5 image4.pan tmp7.pan pgeodesicerosion 0 2 5 tmp7.pan image4.pan tmp8.pan perosion 2 5 tmp8.pan tmp9.pan pgeodesicdilatation 0 2 5 tmp9.pan tmp8.pan image5.pan | 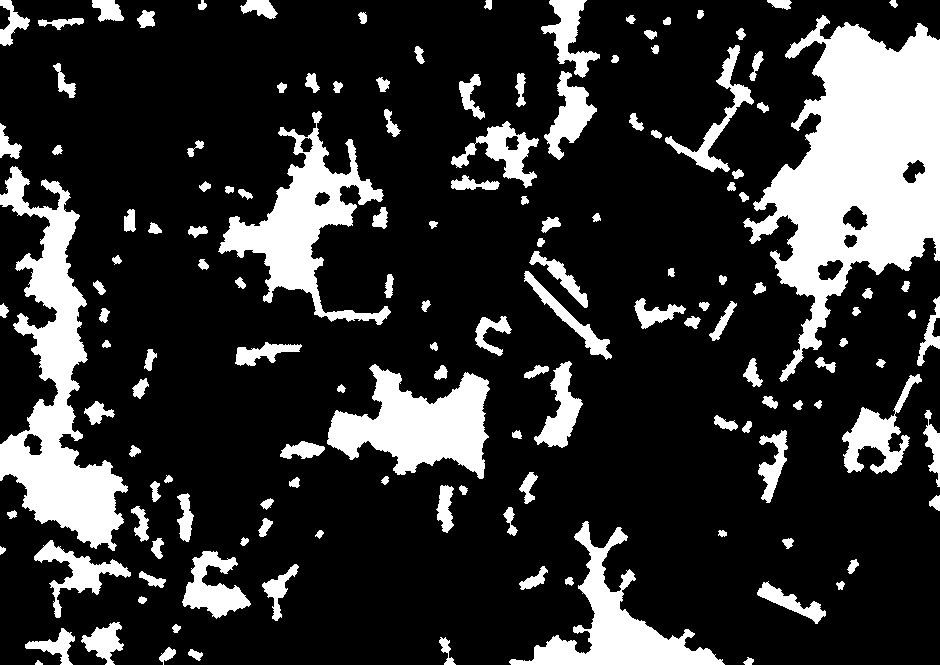 |
| image5.pan: Candidate regions. |
Small regions do not correspond to urban areas. So we will eliminate them using size criteria. We consider that urban areas are bigger than 500 x 500 m2 in the ground (7104 pixels in the image).
pareaopening 8 7104 image5.pan image6.pan | 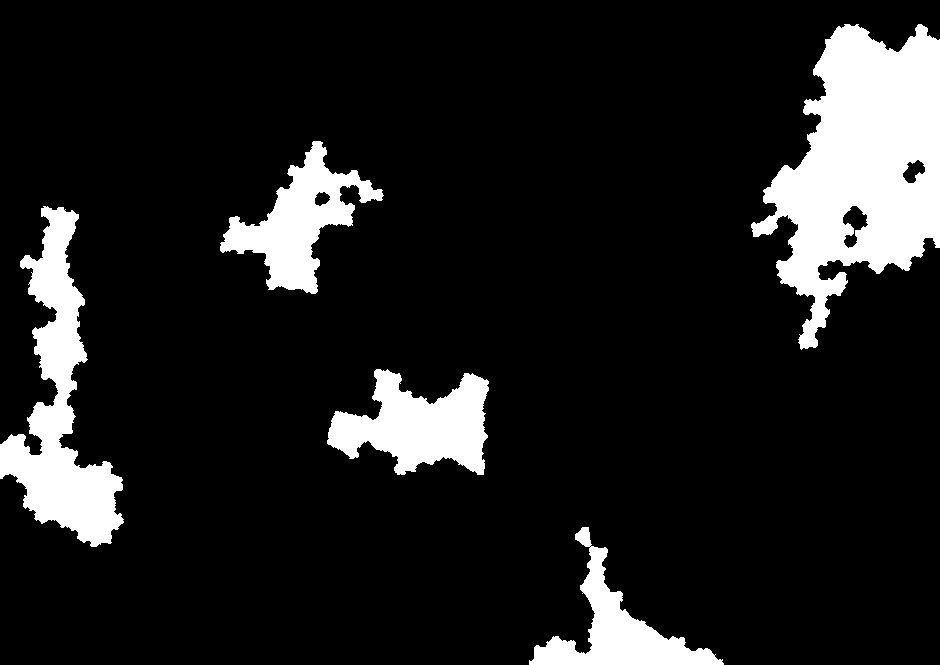 |
| image6.pan: After false alarm removal. |
This operation is just added for the sake of visualization.
pboundary 8 image6.pan tmp10.pan psuperimposition 1 input.pan tmp10.pan output.pan ppan2jpeg output.pan output.jpg |  |
| output.pan: Visualization of the result. |
 Code
Code