IMAGE Team - The Pantheon project
This tutorial describes a method for ranking several image segmentation algorithms according to their performances. The originality of the method is that it takes into account the segmentation task requirements to calculate the performnace measures and perform ranking. The method is described by the way of a running example.
Performance evaluation is based on discrepancy measures between segmentation results and reference segmentations called ground truths.
Performances are evaluated with five indicators, four geometric and one topological. Each indicator is measured by two discrepancy errors between segmentation results and related ground truths. Regarding the segmentation task, the performance value for the indicator is calculated by a tradeoff between the two d'error values. The evaluator should choose the tradeoff type among the 6 given in the right column of the table below.
|
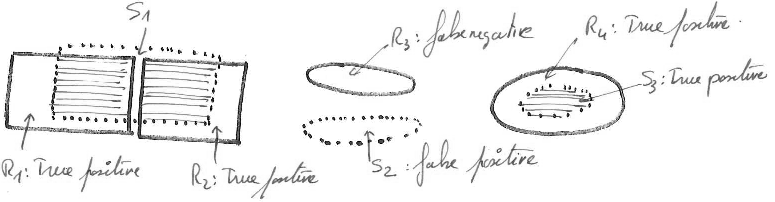
1. Detection accuracy.
This indicator is concerned with how many regions of the ground truth have been detected by the segments of the segmentation result. A segment detects a region if a part of the segment covers a part of the region. There are possibly two types of error. The false negatives are regions of the ground truth that are not covered by a segment. The false positives are segments that do not cover any region. If the detection accuracy indicator is deemed important for a given application, then it is necessary to specify which of the two previous errors is the most acceptable. More precisely, it is required to decide which of the propositions on the right fits the application the best.
|
| ||||||||||||
|
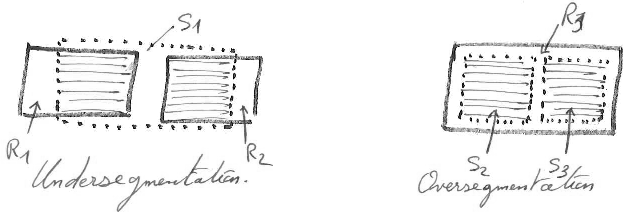
2. Fragmentation consistency.
Ideally, each region should be detected by exactly one segment and each segment should detect exactly one region. But two errors can occur: the over-segmentation corresponds to a subdivision of a region into multiple segments, and the under-segmentation corresponds to a grouping of multiple regions into one segment. As far as fragmentation consistency is concerned for a given application, one of the propositions on the right must be specified regarding the task objectives.
|
| ||||||||||||
|
3. Boundary precision.
Boundary precision is an important concern for a lot of applications. The maximum precision is achieved when the ground truth regions are covered exactly by the related segments. The two types of errors are the excess of pixels when segment pixels are positioned outside the related region boundary, and the deficit of pixels when region pixels are positioned outside the related segment boundary. Assessment of boundary precision must be done regarding one of the propositions on the right.
|
| ||||||||||||
|
4. Shape fidelity.
The shape fidelity assesses how far region shape is from related segment shape. It measures to what extent the excess and the deficit of pixels affect the shape of the detected regions: are the mis-segmented pixels rather spread along the region boundary which slightly modify the shape, or are they concentrated on extra areas which modify significantly the shape? This indicator distinguishes discrepancy errors due to area commission which affects the region exterior and to area omission which affects the region interior. If fidelity to the shape is an important indicator, preference should be given to one of the propositions on the right.
|
| ||||||||||||
|
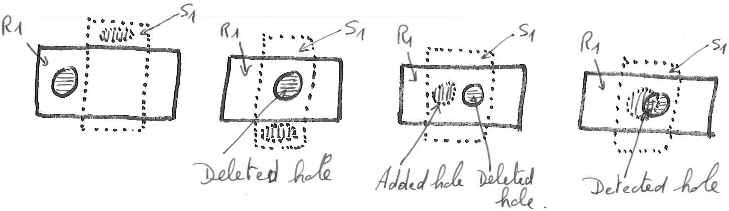
5. Topology preservation.
The topology criterion consists in counting the number of holes. Indeed, in 2D, two regions are topologically equivalent if they have the same number of inner holes. An added hole is a connected component composed of false negative pixels that are completely inside a segment, i.e., a connected component that has only one neighboring segment including the background. So, a hole in a segment that does not intersect the corresponding regions is not an added hole. Similarly, a deleted hole is a connected component composed of false positive pixels that are completely inside the related region. The two possible errors are the hole addition and the hole deletion numbers in the detected regions. The related propositions are those on the right.
|
|
Each indicator value is computed using a tradeoff between the two related antagonist errors regarding what the developer defined as the most acceptable error for the application. The tradeoff implementation depends of the acceptable error chosen for the indicator bu the evaluator:
indicatori=0.
                  |   0.5             0.5      |-1
indicatori = 1 -  | --------   +   ----------  |
                  |  1 - error2    1 - error1  |
                  |   0.8             0.2      |-1
indicatori = 1 -  | --------   +   ----------  |
                  |  1 - error2    1 - error1  |
                  |   0.2             0.8      |-1
indicatori = 1 -  | --------   +   ----------  |
                  |  1 - error2    1 - error1  |
indicatori = errori2
indicatori = errori1
Finally, algorithm ranking is performed using the five indicator computed.
After specifying the most acceptable error for each indicator, the evaluator should then give priority between these indicators regarding the specific needs of the application; ties are possible.
To make the ranking, the priorities are first converted to weights affecting each indicator. This is done using a uniform distribution of the weights over the range [0..1] according to the "Rank Order Centroid" approach. Each weight wi of the indicator i is obtained from the priority j by:
wi = 1/n Sj=in{1/j}
for example, if n=5 then w1=0.4567, w2=0.2567, w3=0.1567, w4=0.0900, and w5=0.0400.
The final ranking is given by the weighted sum of the rank rij of each algorithm i for each indicator j multiplied by the corresponding weight wj:
ri=Sj=1n{rij.wj}
|
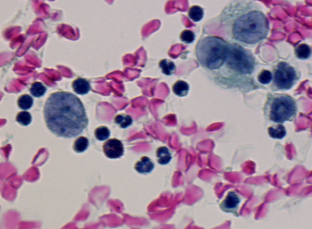
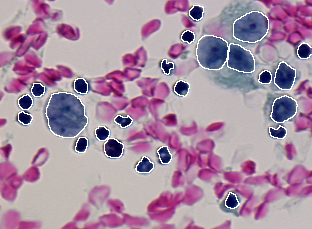
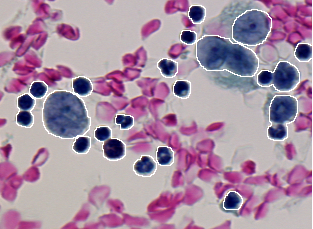
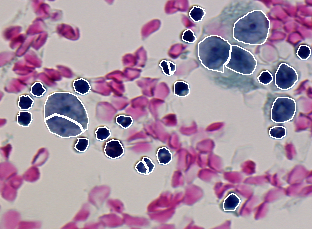
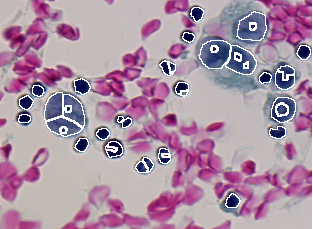
This experiment is a biological application in the context of cancer screening. The purpose is to assist cytotechnologists in finding suspect or abnormal cells from analysis of cytology images. The image segmentation goal is to locate each serous cell as individual region as presented in Figure 1.2. These regions will then be fed into a classifier which has been trained to identify cell types. The complete definition of the problem needs to specify which error is the most acceptable for each of the five indicators. In our study case, these acceptable errors are suggested by the classification requirements:
|
|
|
The Pandore script used to perform evaluation of algorithm performnaces is:
passesssegmentationalgorithm -v \
    0 \
    0.5 \
    cytology/resultimages/a001 \
    cytology/groundtruths \
    /tmp/detail_errors_algo1.pan \
    /tmp/total_errors_algo1.pan
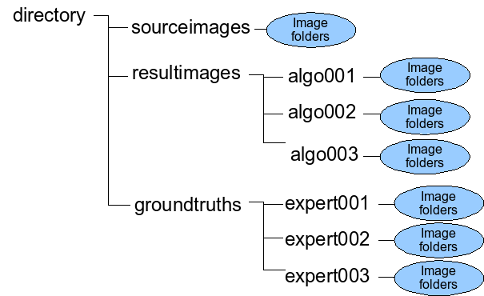
The following table gives the ten discrepancy errors resulted from the comparison of the segmentation result given in Figure 2.3 against the two ground truths given in Figure 2.1 and Figure 2.2. The matching algorithm used (type 0) allows that one region is matched by n segments and one segment matches n regions. The detection threshold is set to 50% (0.50) in order to keep only almost complete cells. A lower thresholding would result in too fragmented cells and would not allow proper identification by classification.
The interpretation of the results is as follows:
|
| |||||||||||||||||||||||||||||||
|
We consider five different image segmentation algorithms, respectively named A, B, C, D and E, and one result yielded by each algorithm while segmenting the image given Figure 3.1. The results are presented in Figures 3.2 to 3.6.
The algorithm performances are given in the following Table 2.
Using the acceptable errors and the priority between indicators given below, the ranking is shown in Table 3:
The ordering given Table 3 indicates that algorithms B and D are the best for this application. B is better in avarage, but D has good performances for the indicator with the higher priority. For this application, either B and D are relevant. Pandore script used to rank the algorithms is:
 pranksegmentationalgorithmsfromfolders \
    0 0.5\
    4 1 \
    2 2 \
    3 3 \
    1 4 \
    1 4 \
    cytology/resultimages/ cytology/groundtruths \
    /tmp/indicators2.pan /tmp/rank2.pan
|
Evaluation and ranking programs are provided with the Pandore distribution. The code provided below does not Pandore. It loads label image in ppm format (see example). However, the code can be easily adapted to any other image formats by changing the image loading functions in the file myinputoutput.h
make -f makefile.unix pranksegmentationalgorithmsfromfolders
nmake -f makefile.msdos pranksegmentationalgorithmsfromfolders.exe
pranksegmentationalgorithmsfromfolders [-v] matching_algorithm_id matching_threshold acceptable_error1 priority1 acceptable_error2 priority2 acceptable_error3 priority3 acceptable_error4 priority4 acceptable_error5 priority5 segmentation_result_path ground_truth_path result_indicators result_ranks
pranksegmentationalgorithmsfromfolders \
    0 0.5\
    4 1 \
    2 2 \
    3 3 \
    1 4 \
    1 4 \
    ./example/resultimages/ \
    ./example/groundtruths \
    /tmp/indicators2.txt /tmp/rank2.txt